
Thankfully, combatting climate change is becoming a much louder conversation. Which means people are becoming more aware of the need to move away from fossil fuels and towards renewable energy sources. Bill Gates has even weighed in, with this recent article. He offers opinion (one of optimism) as well as financial support to ventures trying to solve our climate problems. Let’s not just leave it all up to Bill’s money and his cheery state of mind, however. This is still s global call to action.
I am optimistic that with the right mix of solutions we can deploy right now and new innovations we can build a path to a carbon-free future.
Bill Gates
So then, let’s look at how we’re doing across the globe on introducing renewable energy sources. The below charts present the top 10 countries for both capacity and actual production/utilization. And I’m sure you’ll be as pleased as I am to see that the U.S. is number 2 on both charts! This is fantastic! What’s particularly interesting is that some countries which have the most capacity aren’t necessarily those which produce the most…for instance, while France and Spain feature in the top 10 countries for renewable energy capacity, they don’t then appear in the top 10 for renewable energy production. Norway and The Russian Federation, while not having large enough capacities to feature in the top 10, make far more use of their capacities, meaning the are in the top 10 countries for renewable energy production. You’ll notice that each of the charts are from different years – the data on actual production of energy takes longer to compile and authenticate than data on the country’s capacity to produce this energy. Then the report was published by IRENA in 2018.
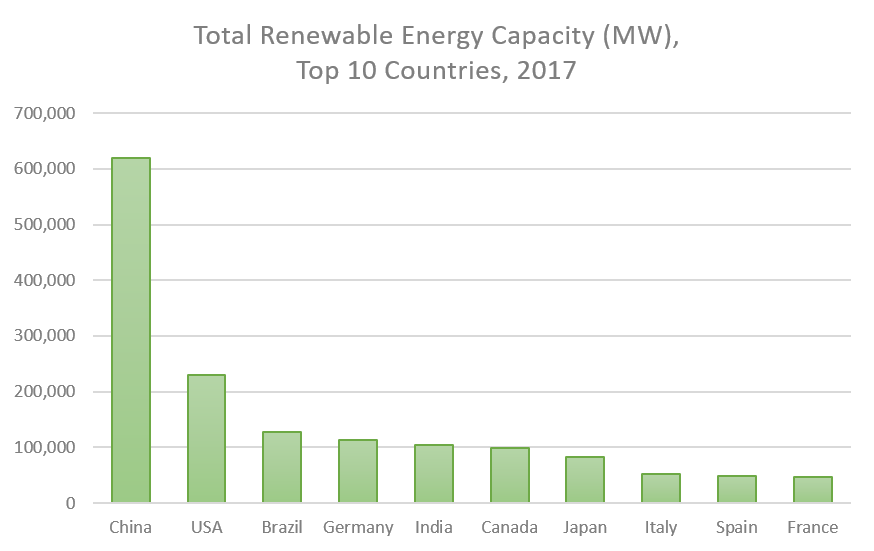


You’ll notice that each of the charts are from different years – the data on actual production of energy takes longer to compile and authenticate than data on the country’s capacity to produce this energy. Then the report was published by IRENA in 2018.
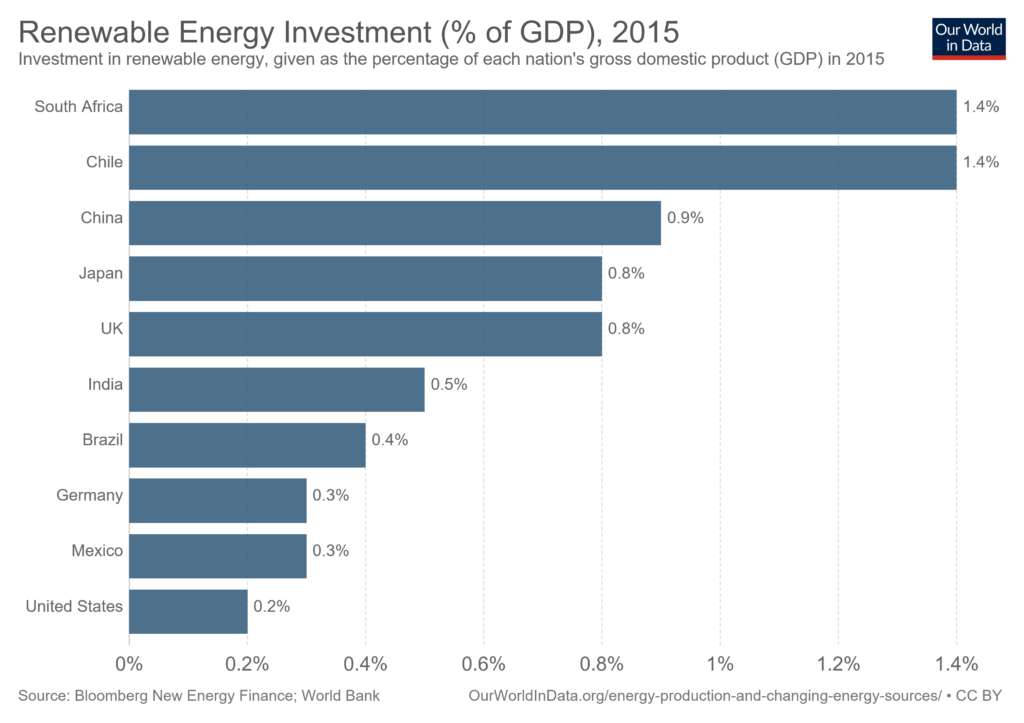
The next thing which I found especially interesting when researching this was where the money is being invested for R & D in this area. Our World in Data provides a very comprehensive look at renewable energy sources, and has some great charts to explain the complex data. The graph below is a good example of this, and shows how much money (as a % of the country’s GDP) is being invested into new renewable energy tech. An alarming finding: countries who are far less wealthy than the United States are spending far more of their GDP on renewable energies. This would seem to me to be somewhat disappointing, and the opposite to what we should expect. However, this reversal of expectation to reality is also mirrored in the fact that the U.S. is extremely above global average on per capita CO2 emissions, as we’ve covered in this previous article. Given that the U.S. is actually the second best country in the world for renewable energy capacity and production, imagine how much better it could be doing with a better proportion of money spent on it? We really do have a responsibility as developed, wealthy country, to lead by example.
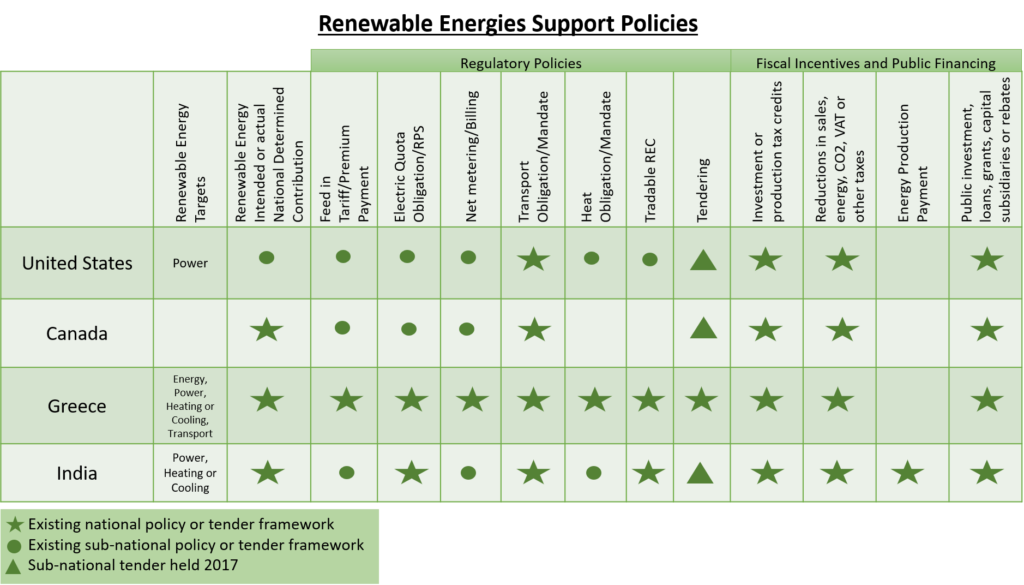
So let’s now look at whether we can expect this to change, based on Governmental policies. While we must all acknowledge that action on climate change starts with each and every one of us, we do want to have policies in place from above to guide us. And the U.S. is definitely heading in the right direction with this. And how fantastic to see Greece and India doing so well with policies ( I chose to highlight these countries as comparison based on having lower GDP but still being environmentally responsible).
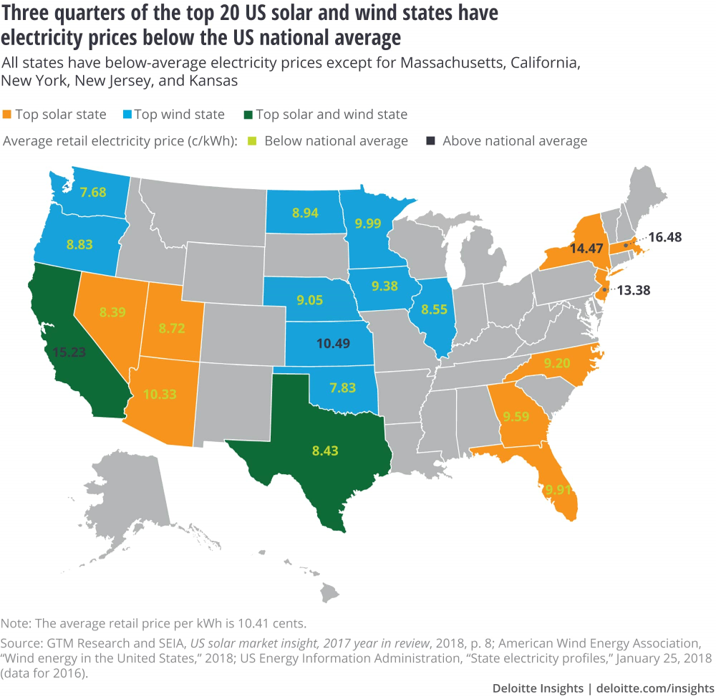
Something else really positive is when we look at the U.S. more closely, we see that several states are actually rewarding residents for the fact that they produce and use renewable energy on the grid. This is great, and hopefully something all states will move towards with the introduction of further Governmental policies, as per the above table.
So, who’s the winner? Definitely China. They are far and away the highest achiever for renewable energy capacity and production. The U.S. is working on it, and with more investment and more robust policies, that very large gap between first and second could be reduced. In terms of which type of renewable source is the leader of the pack, relating to investment and development, which is then leading to increased affordability and access, the winner is wind! Globally, wind has become the cheapest form of energy…yes, even compared with the cheapest fossil fuel, natural gas. By the end of 2017, 121 countries had deployed nearly 495 MW of onshore wind power, led (again) by China. The U.S., Germany, Spain, India, France, Brazil, the UK and Canada have all achieved price parity with wind compared with fossil fuel power! Solar is the next best renewable energy source, from the perspective of cost and availability.
In the meantime, check out if your local government offers any incentives for installing solar panels, or accessing other renewables. Remember to use your power wisely, especially as we approach the summer: try to resist the ‘on’ switch for your air conditioner; and if you can get out and about more in the warmth, you’ll be using less lighting at home too. When you leave the house, remember to unplug everything you can – it will actually save you money and help reduce your carbon footprint, even if only a little, it’s all a step in the right direction!


