Every good story needs a villain. And our human story on this Blue Marble certainly has one: carbon dioxide. Like any well written villain, ours is not one dimensional: there is good and bad within the villain’s heart. We’ve covered the two sides of this element here. In gas form it is but one of the many gases whose combined power is contributing to warming our planet. It is the second most dominant Greenhouse Gas (second to water vapor); it can remain as a heat trapping GHG for 300 to 1,000 years; and it’s the most dominant GHG arising from human activity. For these reasons it’s scored the ring-leader role, and ‘carbon emissions’ is used as a catch-all term for GHG emissions.
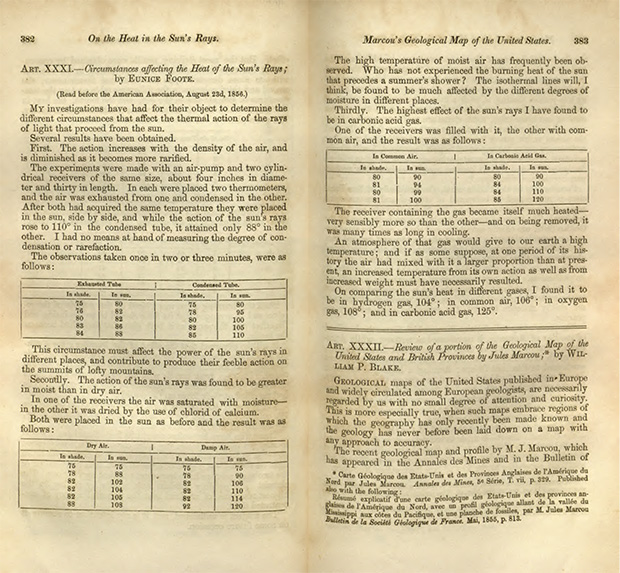
The link between the warming atmosphere and our fervent, seemingly unlimited access to fossil fuels, was documented some 165 years ago, by scientist Eunice Newton Foote. Although her experiments were not definitive and contained many uncontrolled factors, she observed that, “An atmosphere of that gas [carbon dioxide] would give our earth a high temperature”. Indeed. Exactly how much we would come to depend on fossil fuels and the speed at which we would spew GHGs into the atmosphere was certainly beyond prediction. Had Eunice Foote a crystal ball as well as gas-containing cylinders, she may have been able to provide us with clues on how to effectively measure our impact and be prepared to reduce it. This not being the case, we’ve really struggled with appropriate tools to do both.
To exemplify this we’ll get a little science-y for a moment. Each greenhouse gas carries a different level of warming power. So one ton of methane doesn’t create the same warming as one ton of carbon dioxide. To make it possible to measure all GHGs collectively with one metric, the weight of emissions of each gas is multiplied by its 100-year Global Warming Potential value (GWP100), which is the amount of warming one ton of that gas would create relative to one ton of carbon dioxide over a period of 100 years. This gives us the metric of carbon dioxide equivalent (CO2e), and is the metric adopted by the United Nations Framework Convention on Climate Change (UNFCC), hence used in all official and scientific communications. For example, fossil-sourced methane has a GWP100 of ~30, so to calculate the CO2e of methane we would multiply the tons of methane emissions by 30. Interesting to note that methane from non-fossil sources has a slightly smaller GWP100 value.
Even more interesting though, is that the IPCC AR6 suggests that GWP100 doesn’t completely accurately represent short-lived GHGs, such as methane. While this gas is far more powerful than carbon dioxide, the effect methane has in the atmosphere continues for far lesser time. The GWP100 method overstates the effect of constant methane emissions on global surface temperature by a factor of 3-4 over a 20-year horizon, while understates the effect of any new methane source by a factor of 4-5 over the 20 years following the introduction of that new source. To better account for the different physical behaviors of short- and long-lived gases, not just methane, there are new calculation methods being used: GWP*, which is a combination of emissions and changes in emissions levels, and CGTP (Cumulative Global Temperature Potential), which both relate emission changes in short-lived GHGs to emissions of CO2.
This change, and the reason for it, doesn’t change the overarching message: we humans emit too much greenhouse gas, creating a severely warming planet with dangerous consequences for all living things. To understand how to stabilize or reduce a thing, we must first know how to measure it. CO2e is presented in metric tons and is measured from everything we do on Earth which releases any of the GHGs. To make that easier to manage, carbon emission sources are broken up into 3 Scopes.
Scope 1 Emissions
These are direct emissions, for the most part attributable to the direct burning of fossil fuels, like the combustion engine vehicles we drive (or the fleet of a company). Emissions from factory and farming processes are included here, too, like making cement, factory/chemical fumes, ploughing the land which releases soil carbon and the methane from bovine livestock. Often forgotten, and sometimes difficult to track, are fugitive emissions, which are accidental like from leaks in air conditioners or from refrigerants.
Scope 2 Emissions
These are indirect, arising from importing/buying energy from elsewhere, ie., from your electricity supplier. While you’re not in control of the emissions your energy supplier creates to bring you energy, you are in control of how much of that energy you use. So this is any power to operate machinery in a factory, heat or cool your home, operate the cooktop, and charge your computers and EVs, and so on.
Scope 3 Emissions
This is where it gets tricky. These emissions are upstream if you’re a consumer, and both upstream and downstream if you’re a business. Therefore these are not directly within your control. Examples from a company standpoint are employee travel, be that big trips or office commuting; waste disposal; the distribution network; purchasing from suppliers; capital goods like machinery; investments made; leased assets, like machinery or buildings; the use of the products sold by them and the end-of-life disposal of those products.
From a consumer/individual perspective Scope 3 emissions are those related to the goods you buy – so the packaging type and therefore disposal, the end-of-life action after you’ve used the product, and the distribution of getting the product to you are all really important considerations here.
The complexity of measuring and reducing carbon emissions is really why swrm was born. Our major focus in the Hive is to help reduce global carbon emissions. We’re doing this through:
- providing an understanding of why we need to reduce our anthropogenic GHG emissions – the climate science and the impacts of the climate crisis we can expect to see (and are already seeing);
- providing tools and resources to enable GHG reduction, for both individuals and corporates;
- building a community of like-minded, amazing people who understand that this is all about collaboration. One of the things we repeat often and with passion is that this climate crisis cannot be mitigated by working alone or focusing only on one group of people taking responsibility. The burden must be shared by consumers, corporates (retailers, manufacturers, energy agencies and so on) and governments. That’s why we provide different calculators and services for assessing the emissions from different situations. We discuss the approach for businesses, Life Cycle Assessments, here.
The reason we often end our articles with ways you can help is to motivate you and encourage you. We want to grow the swrm and engage as many people as humanly possible to shift the unsustainable trajectory we’re currently on. Every little move you make in the right direction is awesome! There’s a plethora of clichés and quotes which which spring to mind: a journey of a thousand miles begins with a single step; don’t let perfect be the enemy of good; the worst thing you can do is nothing; “what difference can one person make?”, said 7 billion people; and finally, it’s the greatest of all mistakes to do nothing because you can only do little: do what you can. The thing is, these are all TRUE! But what I wanted to emphasize to you today is that carbon emissions calculations are complicated. So not only are we encouraging you, personally, to do what you can, we’re also working with businesses to help them address their emissions. This saving-all-living-things-on-the-planet-thing is a team effort!