
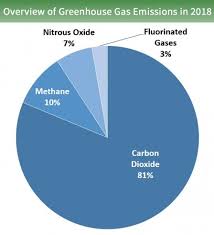
When we discuss climate change, most of our focus is on carbon dioxide or CO2 emissions. But why don’t we talk about other heat trapping gases such as Methane (CH4), Carbon Monoxide (CO) and Nitrous Oxide (N2O)? The short answer is there is more CO2 in the atmosphere than any other greenhouse gas at around 80% of total emissions.
Think of the atmosphere like your stomach. Eating your lunch puts a bunch of different foods and liquids in there. To make it easy, we look at the total calories of all the ingredients together. This is the same concept as our atmosphere, except the calories are referred to as carbon dioxide equivalents.
Now, not everything that goes into our stomach is digested at the same rate. Think of a gas station hot dog versus a 16oz steak. One is going to clear your digestive tract a lot quicker. Our atmosphere works much the same way– some gases stay in the atmosphere a lot longer!
In order to compare both the potency and length of time in the atmosphere, the Global Warming Potential or GWP was developed. The GWP of a gas is a measure of how much energy the emissions of 1 ton of a gas will absorb over a given period of time, relative to the emissions of 1 ton of carbon dioxide (CO2). Generally, we look at the time period of 100 years, however 20 years is also commonly used. Basically, how many calories are in our digestive tract and how long they stay in there.
| GHG | Symbol | Lifetime (years) | GWP20 (Over 20 years) | GWP100 (Over 100 years) | Total emissions (2018) |
|---|---|---|---|---|---|
| Carbon Dioxide | CO2 | 100-1000 | 1 | 1 | 81% |
| Methane | CH4 | 12 | 84 | 28 | 10% |
| Nitrous Oxide | N2O | 121 | 264 | 265 | 7% |
| Tetrafluoroethane | HFC-134a | 13 | 3710 | 1300 | 2% |
| Trichloro-fluoromethane | CFC-11 | 45 | 6900 | 4660 | – |
| Carbon Tetrafluoride | CF4 | 50k | 4880 | 6630 | – |
So why all the concern about methane? Well, methane is over 80 times more potent than CO2. But while methane only lasts a decade in the atmosphere, CO2 emissions cause increases in atmospheric concentrations that will last thousands of years. It’s like cutting down a tree with either dynamite or a butter knife. One is more effective in the short term, but both destroy nature.
For around 10,000 years, the amount of Methane in the atmosphere hovered around 700 parts per billion. Since the Industrial Revolution, that level has jumped up to 1800 parts per billion — and is still rising. Scientists fear that increasing Methane by another two and a half times will have incredibly detrimental effects on our climate that we don’t yet even understand.
So when the Trump Administration moved to roll back the Obama Administration’s regulations on Methane in August 2019, the scientific community was understandably concerned. The new more relaxed EPA mandate replaced previous requirements that oil & gas companies monitor and fix methane leaks from infrastructure equipment such as pipelines, storage facilities and wells.
Where does all the methane come from? Naturally occurring methane emissions primarily come from Wetlands. However, globally 50-65 percent of total methane emissions come from human activities.
| Methane Emission Source (years) | Te of CO2 eq.(million) | Total emissions (2018) |
| Energy | 254 | 28% |
| Agriculture | 248 | 28% |
| Waste (Landfills) | 124 | 7% |
| Land Use & Forestry | 15 | – |
Many sources quote different figures for the emission levels of methane. Methane is a hard gas to track largely due to leaks along the supply chain. Studies suggest the US is producing up to 60% more methane emissions than reported by the EPA.
Remember those regulations that are going to be lifted? They were supposed to help reduce those unreported emissions.
Our big question is, how can these emissions be reduced?
Industry can start by upgrading equipment to reduce CH4 emission leaks and developing better carbon capture technology. Before you put water into your stomach, you make sure the impurities and parasites have been removed, right?
Agriculture can use manure management practices and optimize feeding practices to reduce emissions from enteric fermentation. And, of course, if we all eat less meat, then we can also reduce the amount of methane emissions from agriculture. Less demand equals reduction in supply. Most weight loss techniques involve healthier eating among other things. The same principle should be applied to our atmosphere.
What about waste management? If you tuned into our fantastic interview with William Klimpert from Common Ground Compost, you’ll remember that by composting rather than sending waste to landfill, almost no methane is released. This would be the equivalent of optimizing the diet that goes into our stomach.
A quick side note, many deniers of climate change point to the fact that water vapor is our most abundant heat trapping gas and they would be correct. However, the content of water in the atmosphere is largely determined by climatic conditions and is not governed by the release of water to the atmosphere from human activities. Water vapor will have an average 10-day cycle in the atmosphere. Compare this to the atmospheric cycle of greenhouse gases (decades to millennia) and we can see why scientists don’t include water vapor as a climate change consideration. Not to mention the necessity of our weather events in sustaining human life. The larger issue with water vapor is that it is a product of our Earth’s temperature. When more heat trapping gases are emitted into our atmosphere, the Earth’s temperature rises. As the temperature increases, the atmosphere can hold more water vapor than previously, and the cycle continues.
")

